
AI (probably) Won’t Kill You, But The Multiple May

Four measures of what today’s equity prices assume, and how they have held up
Have you ever overcooked something? Chances are at least one memory just came to mind, and I hope it brought a chuckle rather than a wince. Like many things in life, the difference between good and bad taste is often knowing when to stop. While not a cook, I feel obliged to label myself a foodie and if that just triggered an involuntary eyeroll, I totally get it. I lived in Manhattan for over a decade where omakase, prix fixe menus, oyster happy hours, and brunch were part of our regular pace of life (brunch has died, so I hear). Well, a decade and a half and two kids later I’m over it, too, or at least my body is. The heartburn can be intense. Too rich for my blood, as the saying goes, a reaction not too dissimilar from buying the equity market at these valuations. Maybe it’s time to stop buying the market for our health, too. It doesn’t mean the meal will be bad, but perhaps it will no longer bring the joy it was meant to for now.
The 10-year Treasury yield closed September at 5.29%, its highest level since 2002, and at 40.6 the Shiller cyclically adjusted price-to-earnings ratio (the CAPE) is higher than 97% of the months since 1962. Neither fact is news, so rather than restate the case that expensive markets tend to deliver lower returns, this letter goes deeper on four things we built from the underlying data: how concentrated the expected earnings growth is and how often forecasts like it have been met, what new money has earned when stocks were this expensive, what the AI spending bill means company by company, and what the evidence says so far. Together they say the price already assumes a great deal goes right, while the cost of being wrong has grown.
Twenty companies, most of the growth
Wall Street expects S&P 500 earnings to grow 18% over the next twelve months. Twenty semiconductor and hardware companies, 14% of the index’s current earnings, are expected to supply 63% of that growth, and two of them, Nvidia and Micron, 44%. The other 474 companies are expected to grow 7.7%.
To see how unusual that is, we rebuilt the consensus forecast for the 500 largest US companies every September back to 2000, including the companies that later failed, merged or were taken private, so the history is not just today’s survivors. Measured the same way each year, the 20 companies contributing the most usually supply about 40% of the expected growth. Today it is 68%, the highest in the record. The two prior highs, 53% in 2003 and 54% in 2009, were rebounds: technology, media, and telecom companies coming off the bust in 2003, and banks, insurers and automakers recovering from losses in 2009. Today’s leaders are not recovering from anything. They already earn 28% of the index’s profits, double the 14% the 2003 leaders earned, and the forecast asks them to grow from there.
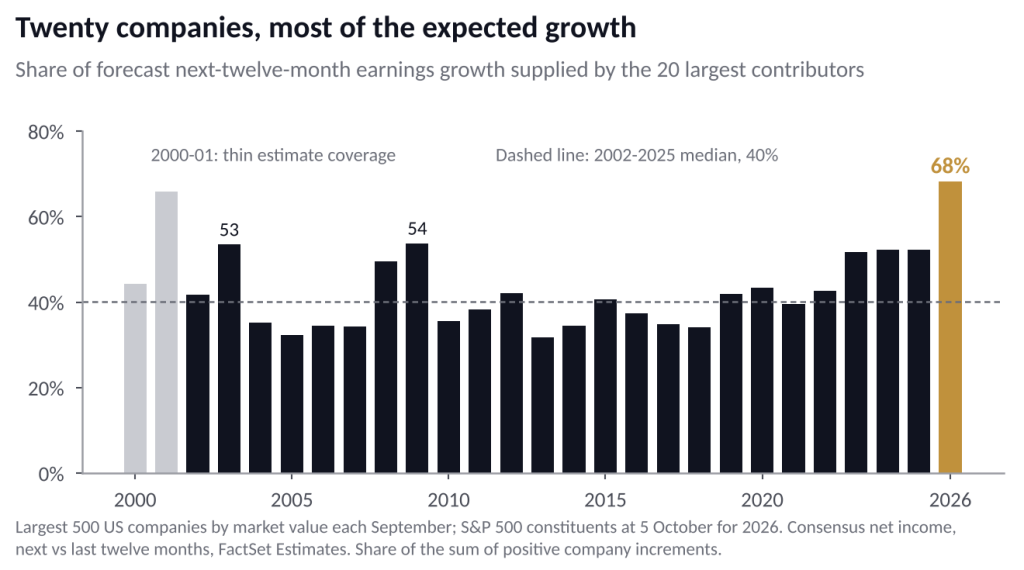
Forecasts like this have historically trended too high. In 16 of the 25 years from 2000 to 2024, index earnings fell short of what analysts expected twelve months earlier, and the median year delivered 8.4% growth against a forecast of 12.8%. The 20 biggest contributors delivered their full forecast increase in only 9 of those 25 years, and about 80% of it in a typical year. When the economy turned, they did not merely fall short; their earnings went backwards. In September 2000 the list was heavy with Micron, Cisco, Applied Materials, Lucent and Motorola, and the group was expected to grow earnings 23%. A year later its earnings were down 18%.
The strongest case against my concern is the recent record. In each of the last three years the leaders beat their forecasts, Nvidia by a wide margin, so analysts have been too cautious on AI rather than too eager (the latest year is not yet fully reported). Those beats came early in the spending cycle and from a much lower base. I take that seriously. The point is not that the forecasts are wrong. It is that the index’s growth now rests on one spending cycle more heavily than at any time in at least 26 years, and history says that is when a miss costs the most.
What new money has earned at these prices
From January 1998 through June 2002, money put into the S&P 500 in any month earned less over the following decade than a 10-year Treasury bought the same month. We extended that test to every month since 1881 with a full decade of returns behind it, 1,629 of them. Across all of history, stocks trailed treasuries in 15% of months, and up to a CAPE of 30 that share of treasuries outperforming never rose above 24%. Between CAPEs of 30 and 35 it was 74%, and above 35 it was every month. Valuation did not condemn new money until the market got this expensive; past that line, it nearly always did. Those expensive months come from only two periods, 1929 and 1997 to 2002, so this is a pattern with few independent observations, not a law.
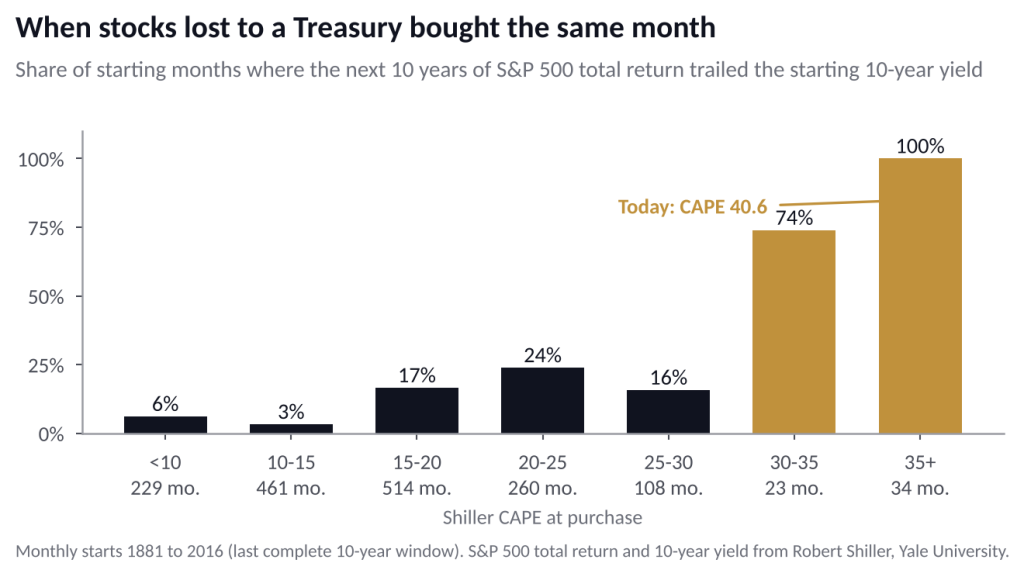
The competitor that mattered was the bond, not cash. Across 1997 to 2002, when the CAPE sat in the top tenth of its history, stocks trailed a Treasury held to maturity in 84% of starting months and a 60% stock, 40% bond mix in 90% of them, but beat Treasury bills about half the time. Spreading purchases out did not help. Someone who invested the same amount every month from January 1998 to June 2002 earned 2.5% a year on stocks through 2012, against 6.8% in Treasuries and 4.6% in a 60/40 mix. Investing it all in January 1998 did better, at 4.0% a year, because steady buying kept adding money at prices that were still expensive. It spread the entry across the whole stretch rather than avoiding it.
The current expensive stretch looks like a challenge to all of this, and it deserves an answer. The CAPE has been in its top tenth since February 2017, and someone who has bought every month since then has earned about 16% a year, against roughly nothing in a rolling 10-year Treasury position. Those buyers started with three things today’s buyer does not have: a Treasury alternative yielding roughly 2% to 3% rather than 5.3%, earnings early in a capital spending cycle and growing from a lower base, and a world awash in capital to fund an emerging technology. Every era has its own structure, which is why I lean on principles that hold across cycles: what you pay relative to the alternative, how much growth is already assumed, and whether new capital earns its cost. On all three, today’s buyer starts from a weaker position than the buyer of 2017.
The depreciation bill, company by company
Microsoft, Amazon, Alphabet, Meta and Oracle are expected to spend $840 billion on capital projects in their current fiscal years and $1.08 trillion the year after. Wall Street already expects their combined depreciation and amortization to nearly double in two years, from $217 billion to $418 billion. The question is not whether that expense arrives but whether the profits arrive with it.
A simple test: take the two years of spending, $1.92 trillion, and ask what return the consensus profit forecast implies on it. Analysts expect the five to add $314 billion of operating profit between this fiscal year and two years out. After tax, that is a 13.6% return on the new money, against a cost of capital of about 10.3%. On consensus numbers, the spending pays. The test is generous, since it credits every dollar of profit growth to the new spending, including growth the companies would have had anyway. Company by company the cushion varies: Microsoft 16.0% against a 9.9% cost of capital, Alphabet 15.5% against 10.3%, Oracle 15.2% against 10.3%, Amazon 12.3% against 10.8%, and Meta 8.7% against 10.1%. Meta falls short even on consensus, and that is after it lengthened its server lives last year, which added $2.6 billion to its 2025 net income.
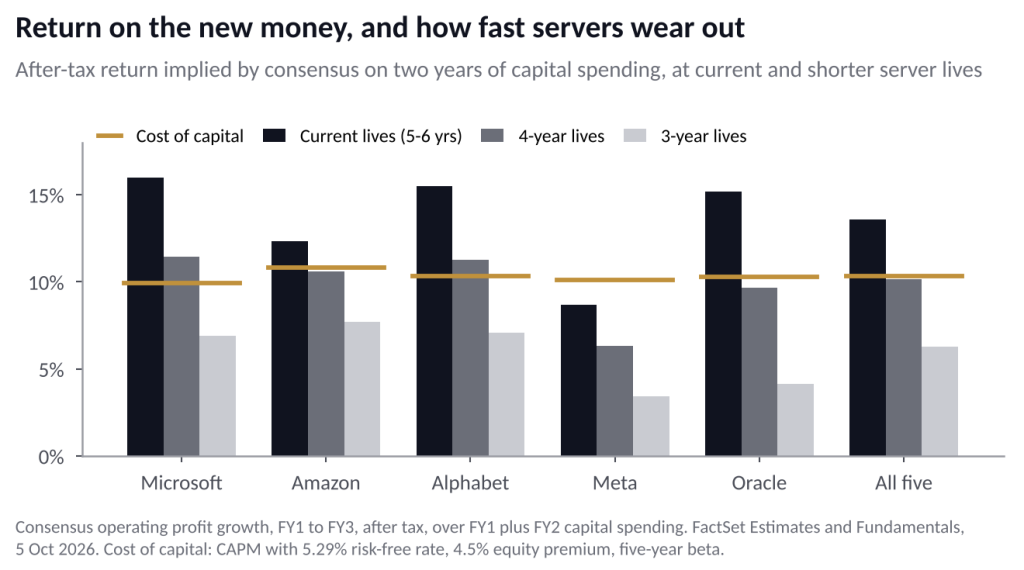
Everything turns on how long the servers last. The companies depreciate them over five to six years today: Microsoft, Alphabet and Oracle use six, Meta five and a half, and Amazon cut some servers back to five last year, citing the pace of change in AI. If the machines stay economically useful for four years instead, the return across the five falls to 10.1%, right at the cost of capital, and Amazon, Oracle and Meta drop below theirs. To earn their cost of capital the five would then need $909 billion of added revenue over two years, more than the $885 billion (43%) analysts already forecast. At three years, the return falls to 6.3%.
Is four years realistic? The rental market offers a clue. An Nvidia H100, the workhorse AI chip of 2023, rented for around $8 an hour on demand in early 2024 and for about $2 by the end of that year, as supply caught up and newer chips arrived. A chip’s economic life is set by what it can earn, not by how long it runs, and that is why rental prices are on my watch list.
The scorecard so far
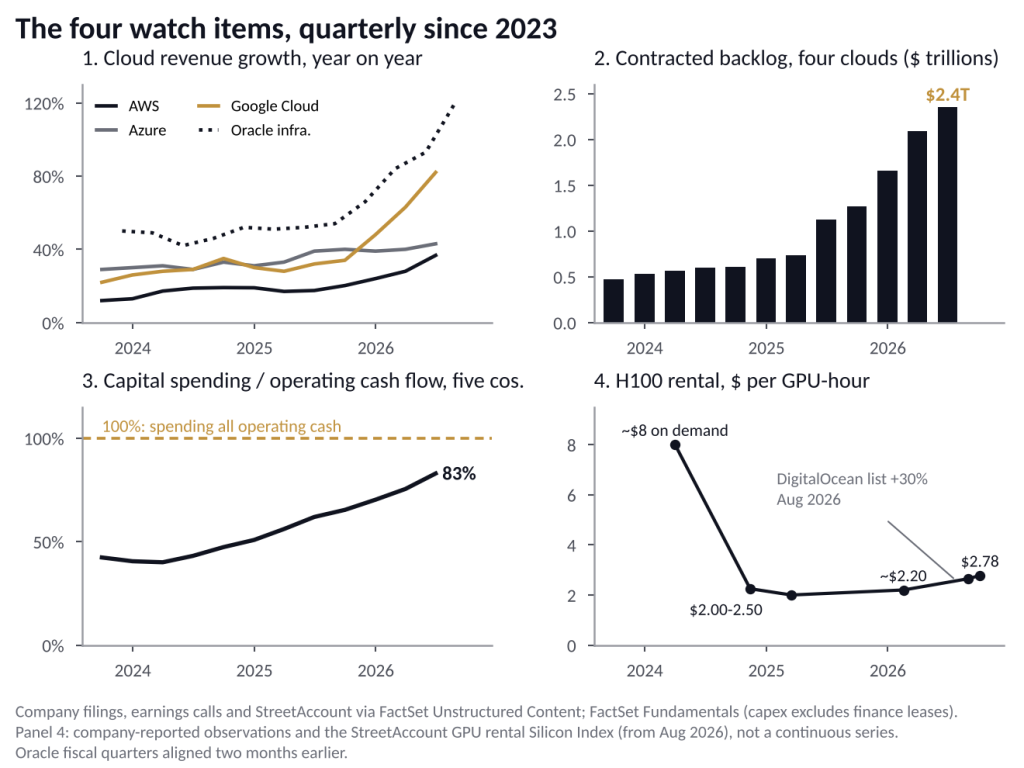
I said I would watch four things to tell which way this goes. Here they are, quarterly back to 2023, with the levels that would change my mind. Three of the four still favor the optimists.
Cloud growth has accelerated, not slowed. Amazon Web Services grew 12% in the third quarter of 2023 and 37% last quarter; Microsoft’s Azure went from 29% to 43%, Google Cloud from 22% to 82%, and Oracle’s infrastructure business from 50% to 121%. What would worry me: two straight quarters of slowing growth at three of the four.
Contracted backlog at the four has grown from about $475 billion to about $2.4 trillion, and more than doubled in the past year alone. A large part comes from a handful of AI developers, OpenAI and Anthropic among them, in which these same companies and their chip suppliers have invested, so part of the demand is circular and the backlog is only as good as those customers’ funding. What would worry me: a quarterly decline, or a large customer renegotiating.
Chip rental prices have firmed. After the 2024 collapse, H100 rates held near $2 an hour through 2025 and have risen this year; one cloud provider raised its list price 30% in August, and an industry rental index moved from $2.65 to $2.78 over the past five weeks. What would worry me: rates back below $2.
The fourth is the one I am watching most closely. Capital spending took 42% of the five companies’ operating cash flow in 2023 and takes 83% today, up nine quarters in a row. Amazon and Oracle already spend more than they generate, at 107% and 161%. What would worry me: the group crossing 100%, at which point the build is financed with borrowing and the market has to decide what it is worth.
None of this says the technology fails. It says today’s price assumes a narrow group meets its forecasts, the new spending earns its keep on schedule, and investors are paid for giving up a 5.3% Treasury. Each of those has historically been a worse bet than it looked when it was made.
What we are doing
Taking profits in equities, back to position sizes set for a world in which Treasuries yield four to five percent rather than two to three, with tax loss harvesting in place where it can make the rebalancing less painful. Our view is to own investment-grade bonds of shorter maturities across Treasuries, municipals, corporates, and structured credit. We may be able to extend maturities once the bond market has had more of a say in the current state of inflationary and fiscal affairs. There is a broad menu of fixed income to work through as this plays out. For now, Treasuries and municipals with maturities of less than three years may be a good place to park equity profits. Staying high in quality, owning single stocks over indices could be a good option where appropriate. There is no substitute for owning high-quality businesses with secular growth that work through economic cycles; the difficulty is that over the past 20 years the best performers often began outside of the S&P 500 index, and only a few of those companies were part of FAANG or the MAG 7. Identifying these companies has also required a disciplined, long-term perspective.
Tim O’Mara, CFA
Sources and method. Earnings concentration: FactSet Estimates consensus net income (mean, USD), next twelve months and last twelve months, point in time each 29 September 2000 to 2025, for the 500 largest US-listed common stocks by FactSet market value at each date, including companies later delisted or acquired; the 2026 figures are the sum of FactSet consensus (adjusted) net income for 494 S&P 500 constituents as of 5 October 2026, a slightly different universe. Concentration is the 20 largest company increases as a share of all positive increases. Realized growth is consensus-basis trailing net income one year later; companies with no figure a year later drop out, which flatters the realized record most in 2000 to 2002, and estimate coverage is thin in 2000 and 2001. New money: S&P 500 total return, the 10-year Treasury yield, 10-year Treasury total return and the CAPE are from Robert Shiller, Yale University, monthly, 1881 to September 2026; Treasury bill yields are the Federal Reserve H.15 3-month secondary-market series from FactSet, daily averaged monthly, 1970 onward. Ten-year windows step monthly and overlap heavily: 1,629 windows contain about 14 independent decades, and the months with a CAPE above 30 come from two episodes. The Treasury comparison treats each month’s 10-year yield as the return on a bond bought that month and held to maturity; the 60/40 mix rebalances monthly; steady-investing returns are money-weighted. The top tenth of CAPE history is above 28.3. Depreciation test: FactSet Estimates consensus capital spending, operating profit (EBIT), revenue and depreciation and amortization for fiscal years one to three, and FactSet Fundamentals, as of 5 October 2026. Return is the change in consensus operating profit from fiscal year one to three, after each company’s three-year average effective tax rate, divided by fiscal year one and two capital spending. Cost of capital uses a 5.29% risk-free rate, a 4.5% equity risk premium, five-year monthly betas against SPY from FactSet Global Prices, and market-value weights of equity and debt. Server lives and their changes are from company Form 10-K and 10-Q filings and earnings calls; the server share of spending is about two-thirds at Microsoft and 60% at Alphabet per management, an assumed 75% at Oracle, which says the “vast majority” is equipment, and about 42% to 43% at Amazon and Meta, derived from reported property and equipment. The shorter-life cases add the extra annual depreciation on the server share of two years of spending. Watch items: cloud revenue growth and contracted backlog (Microsoft commercial remaining performance obligations, Oracle remaining performance obligations, Google Cloud backlog, with Alphabet total obligations before mid-2025, and AWS backlog) are from company filings, earnings calls and StreetAccount via FactSet Unstructured Content; Oracle fiscal quarters are aligned two months earlier. Capital spending excludes finance leases and, with operating cash flow, is trailing twelve months from FactSet Fundamentals through June 2026 (Oracle through August 2026). Chip rental prices are company-reported observations and the StreetAccount GPU rental Silicon Index, weekly from 31 August 2026; they are not a continuous series. The early-2024 H100 price is a company’s retrospective estimate. The 10-year yield close is the H.15 constant-maturity series. Views on artificial intelligence are the author’s opinion. The full study is available on request.
Important disclosures. This letter is provided by Opima Capital Management, a registered investment adviser, for the information of its clients. It expresses the author’s views as of the date above, which are subject to change without notice, and is not personalized investment advice or a recommendation to buy or sell any security. Any changes to a client’s portfolio will be made in accordance with that client’s investment policy and will be discussed with the client. Historical index returns are presented for illustrative purposes, do not reflect the deduction of fees or expenses, and are not indicative of future results. The new-money and steady-investing comparisons are illustrations built from index and Treasury returns; they are not the performance of any Opima account or strategy and do not reflect fees, expenses or taxes. Consensus estimates are third-party forecasts and may not be realized. Indices are unmanaged and cannot be invested in directly. Data from third-party sources is believed to be reliable but is not guaranteed.